Data Analysis · Digital Advertising · Music Industry

The Fan Funnel

How paid digital media converts casual listeners into fans, and fans into buyers.

133K+ Campaigns Analyzed
732M Total Impressions
5.8M Conversions
4 Major Platforms

About This Project

This analysis explores how digital advertising campaigns perform across platforms, audiences, and geographies, with the music and entertainment industry as the lens. Using 133,000 simulated campaign records paired with real Spotify streaming data, I built a data story that mirrors the work Gupta Media does every day for clients like Sony Music, Universal, and SXSW.

Tools & Data

Tableau Python Spotify Global Streaming Data Marketing Campaign Dataset CPM · CTR · CPC · CPA 133K Records

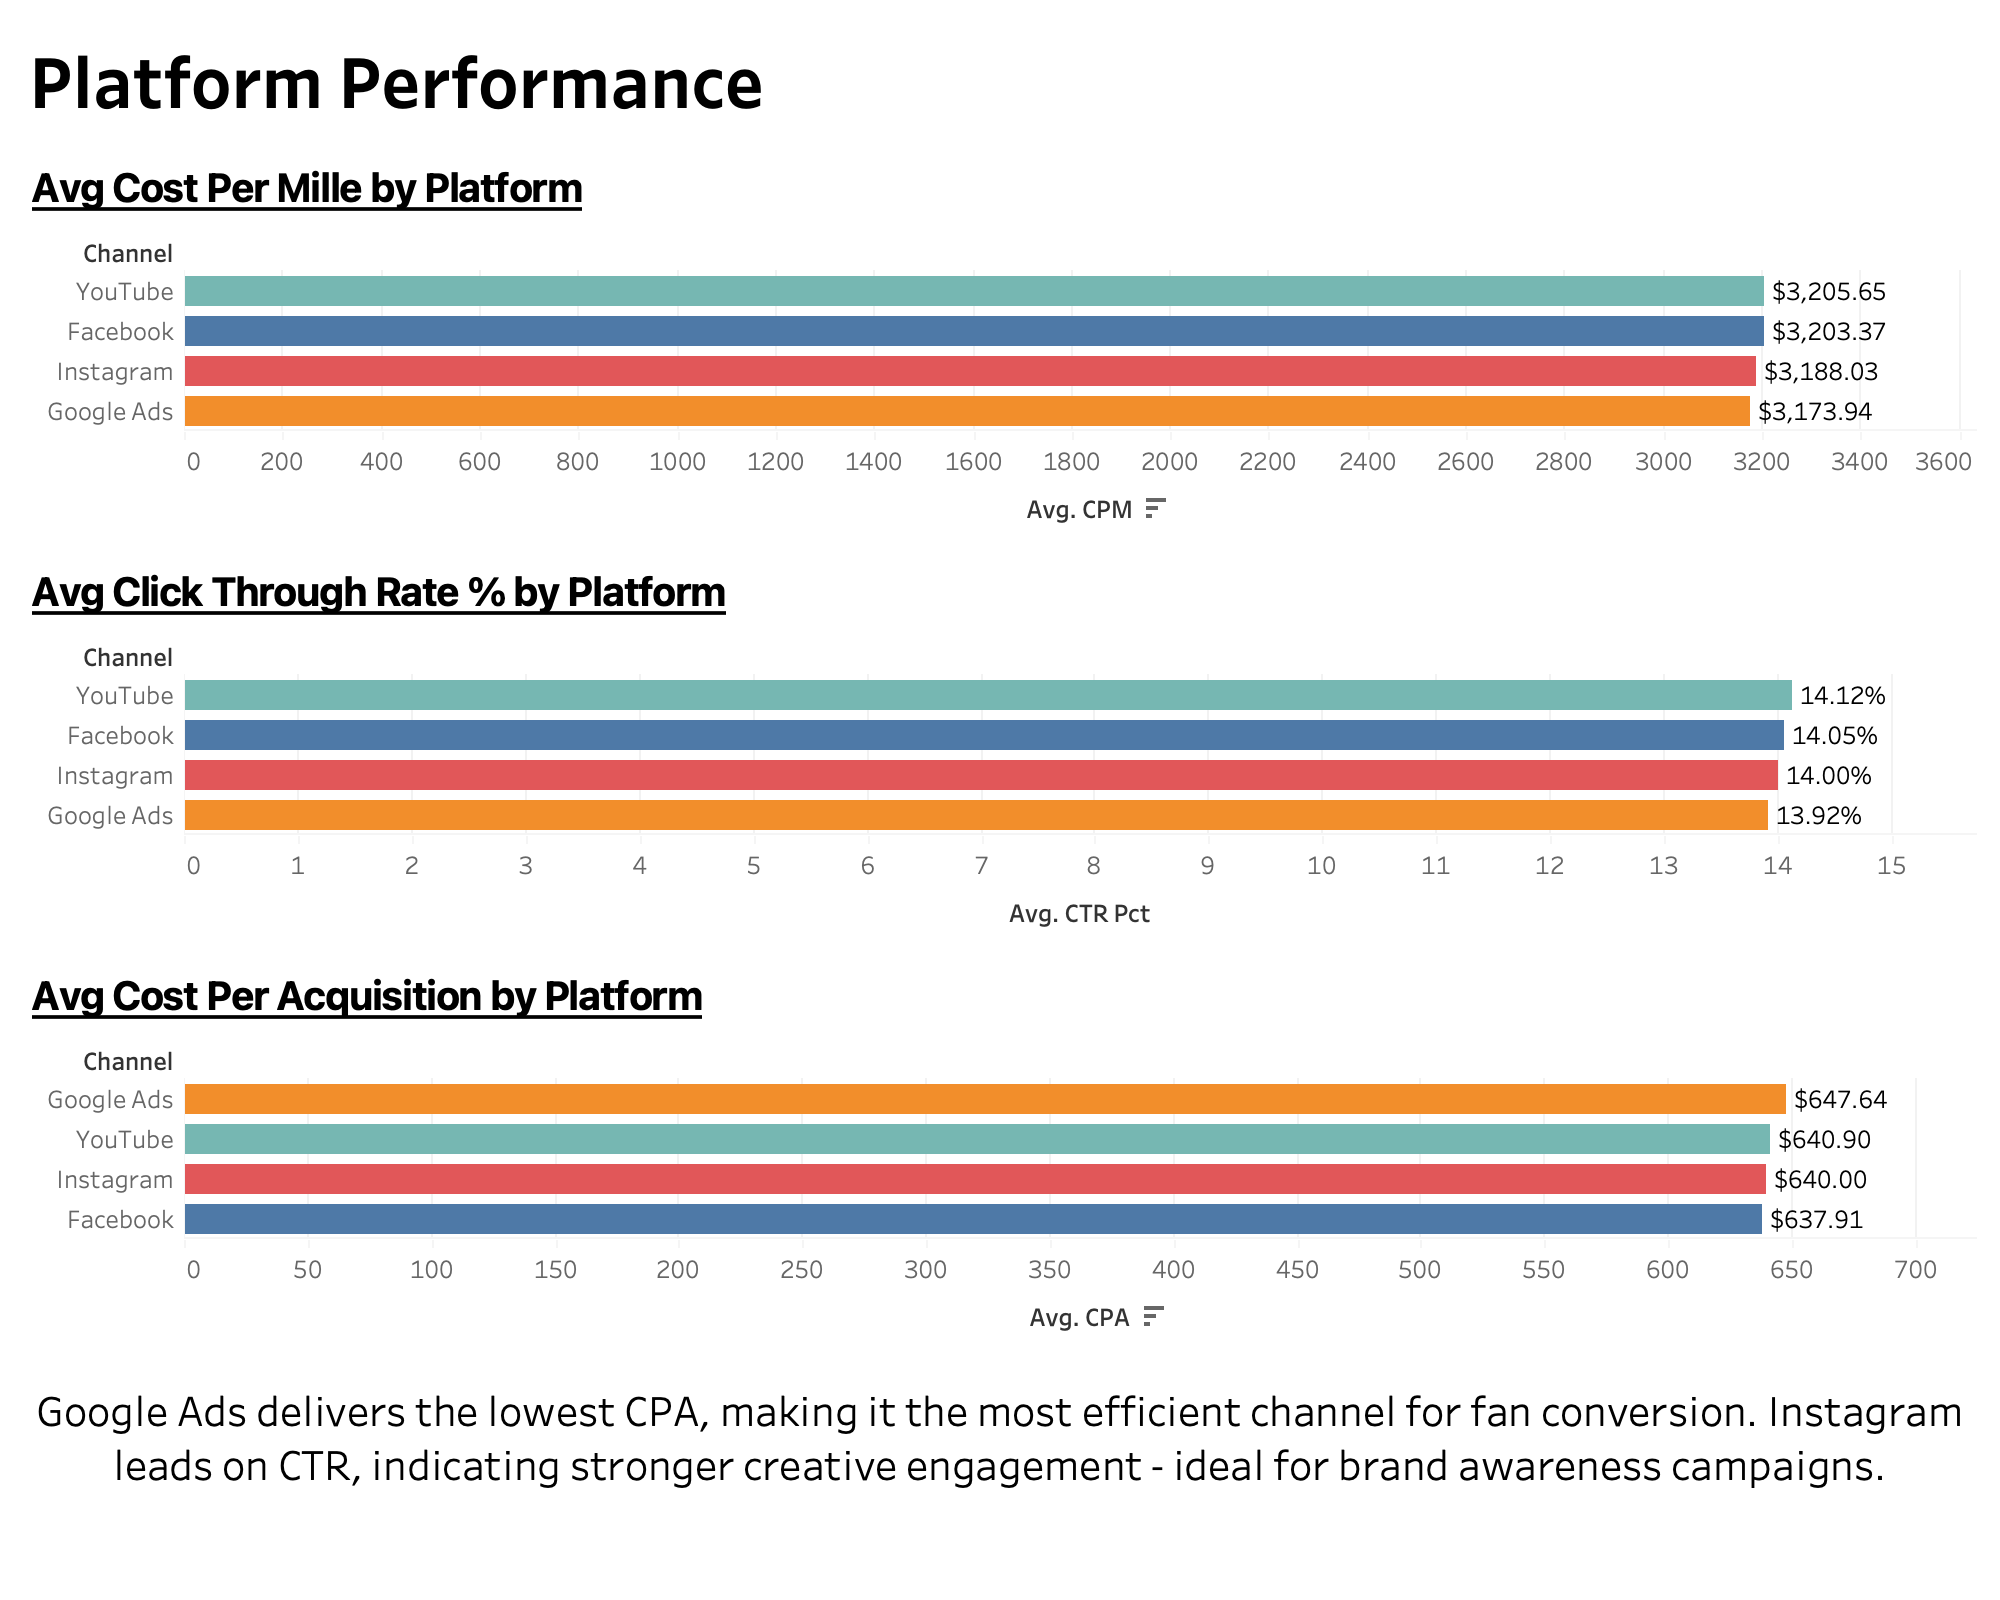
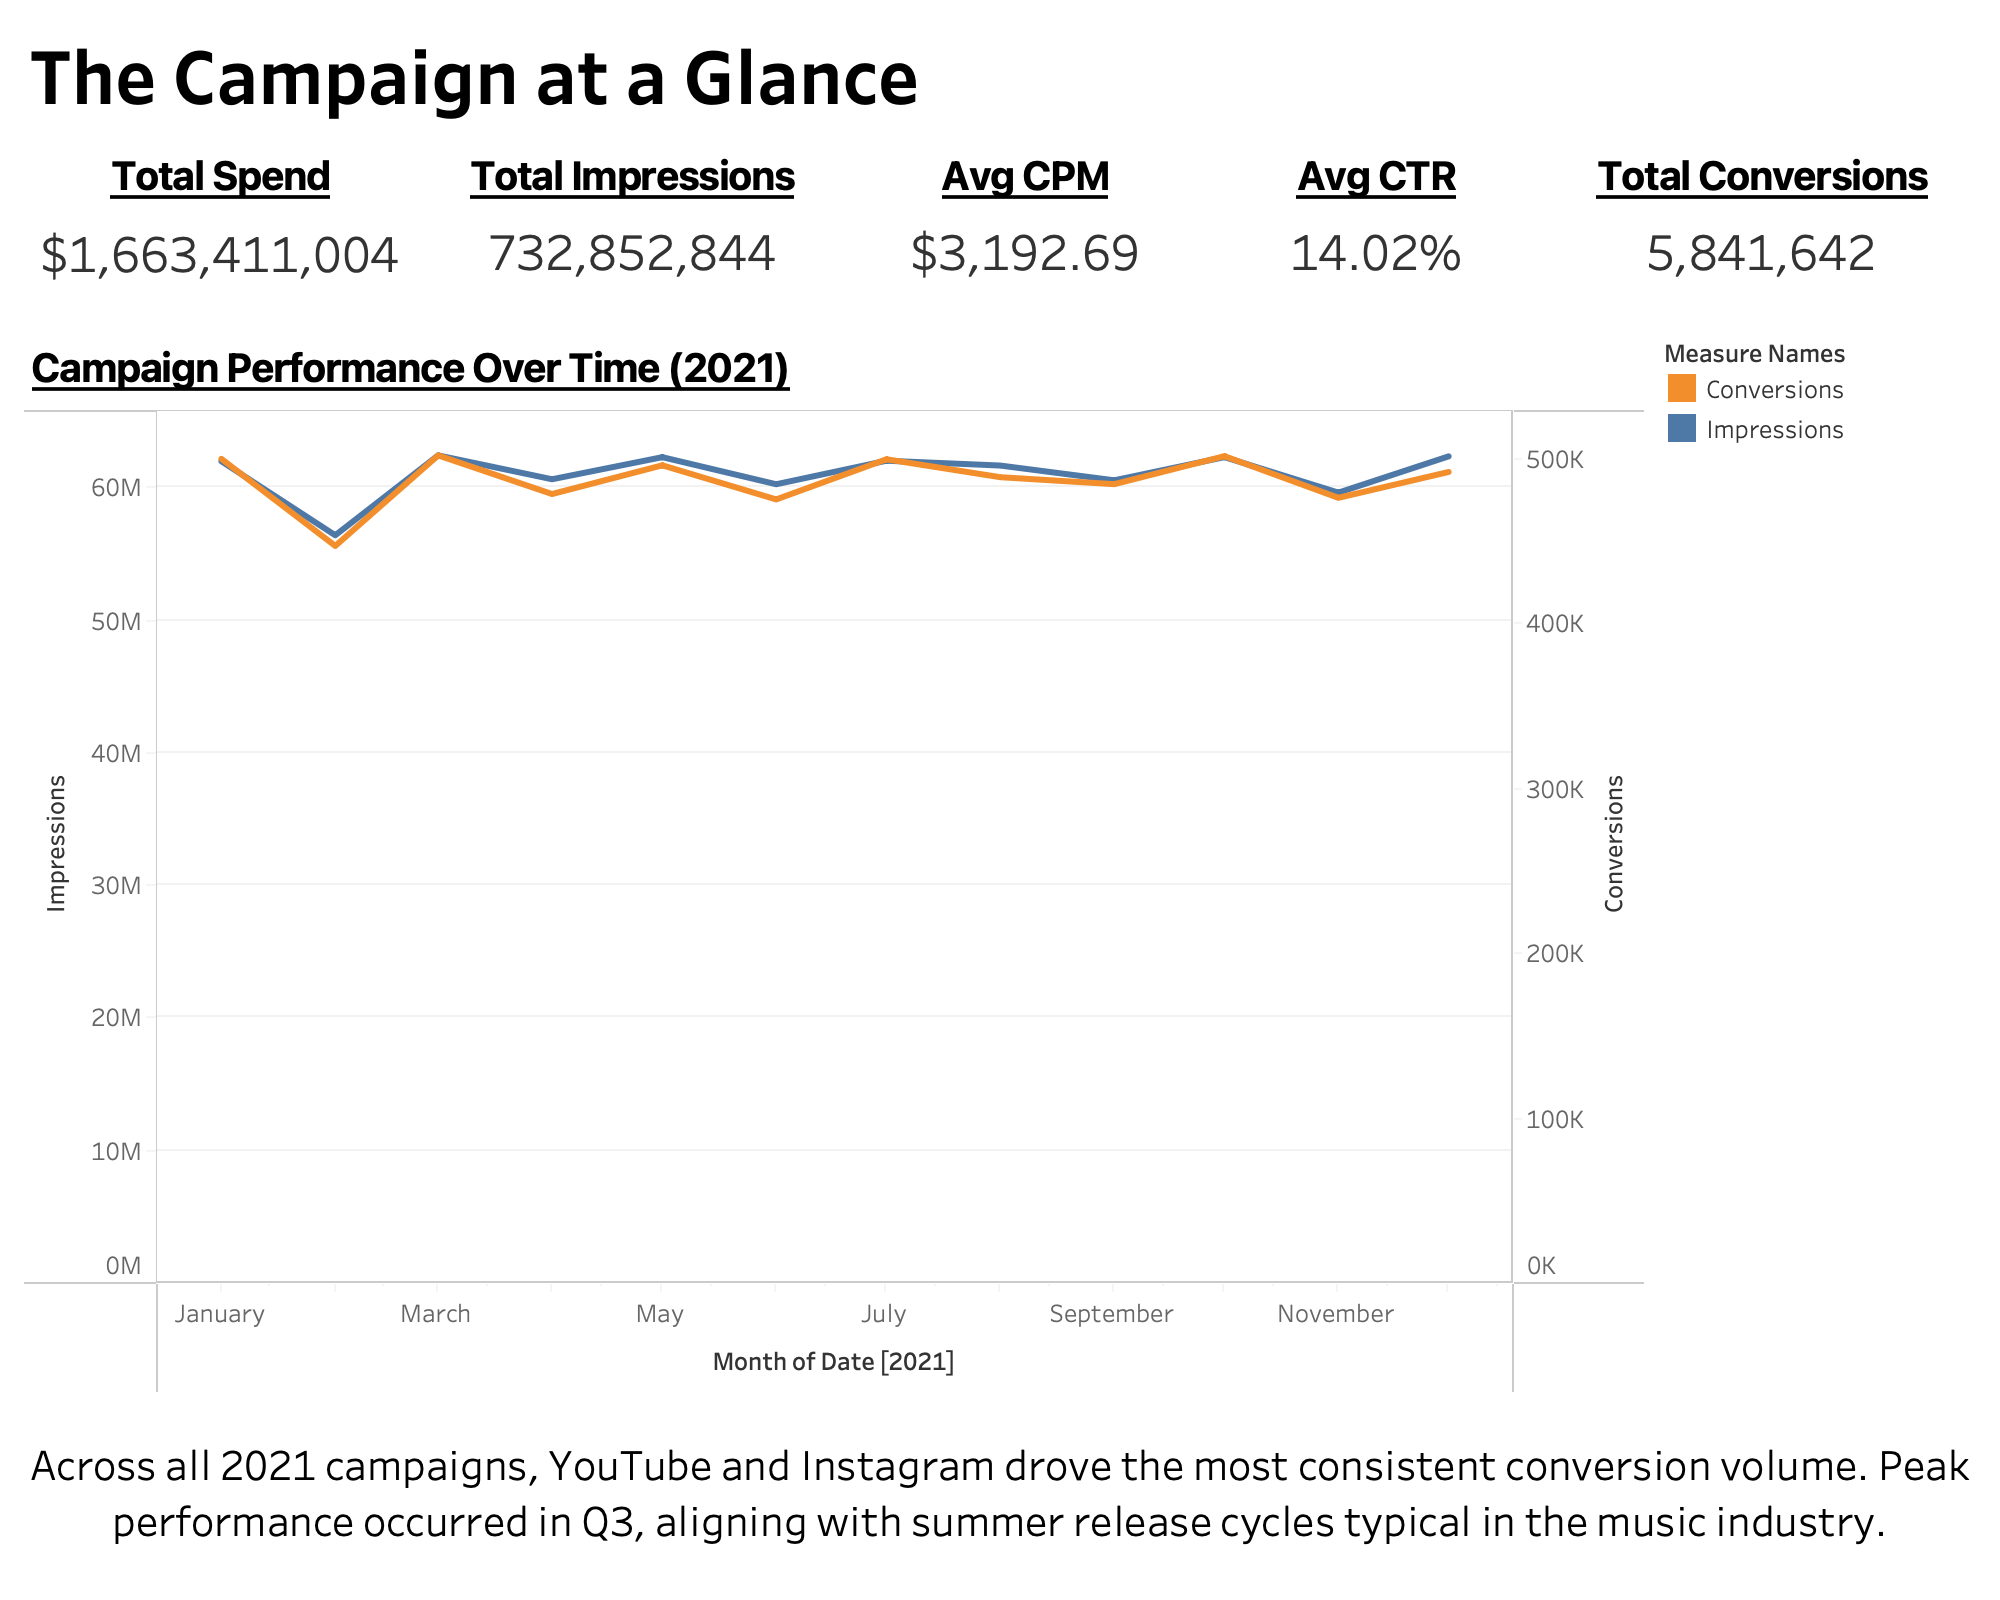
The Campaign at a Glance

$1.66B
Total Spend
732M
Total Impressions
$3,192
Avg CPM
14.02%
Avg CTR
5.84M
Total Conversions
Campaign at a Glance Dashboard
Key Insight

Campaign volume held steady across all 12 months of 2021, with impressions and conversions tracking closely together, a signal of consistent targeting efficiency. Slight dips in February and November are consistent with the music industry's release calendar, where Q1 and Q4 see reduced campaign activity between major album cycles. The tight correlation between impressions and conversions across every month suggests strong audience-creative alignment throughout the year.

Platform Performance

Facebook
Lowest CPA: $637.91
YouTube
Highest CTR: 14.12%
<2%
Variance Across All Platforms
Platform Performance Dashboard
Key Insight

Facebook delivered the lowest Cost Per Acquisition at $637.91, making it the most budget-efficient platform for converting music fans. YouTube led on CTR at 14.12%, indicating that video creative drives the strongest click engagement, critical for campaign types like album launches and tour announcements where storytelling matters. Notably, all four platforms performed within 2% of each other across every metric, suggesting that audience targeting quality and creative execution outweigh platform choice alone.

Who's Converting?

8.16%
Peak Conversion Rate
Men 18–24
Top Converting Demographic
Miami
Highest Market Spend: $337M
Who's Converting Dashboard
Key Insight

Rock & Country Fans on Google Ads achieved the highest conversion rate at 8.16%, while EDM & Workout Fans showed the most consistent performance across all four platforms, making them the safest bet for broad multi-channel campaigns. Men 18–24 led total conversion volume, consistent with Spotify's data showing this demographic as the fastest-growing streaming segment. Geographic spend was distributed evenly across five major US markets, with Miami and Chicago absorbing the most investment, both key markets for live music and touring.

The Music Market

Indie
Lowest Skip Rate: Most Captive Audience
197B
Classical Total Streams
R&B
Highest Engagement Quality Score
Music Market Dashboard
Key Insight

Raw stream volume alone doesn't tell the full story. While Classical and Rock lead in total streams, the engagement scatter reveals a more nuanced targeting opportunity: Indie and R&B audiences skip less and listen longer, meaning they're significantly more receptive to ad placement. Pop, despite its massive reach, carries the highest skip rate of any genre, signaling that creative quality and ad format matter more in that segment than in others. For a client like Sony Music or Universal, this data would directly inform which genres receive pre-roll video versus display placements.